Carbon data from design documents
EPD-backed embodied carbon from your actual project data, in hours. Meet reporting requirements. Track carbon across design phases. Benchmark your portfolio.
How it works
From documents to carbon data
Connect your documents
Upload your Revit model and PDF drawings, or sync from Autodesk Construction Cloud. Tangible reads both.
Review and refine
AI maps every building element to an assembly, links each material to an EPD, and calculates embodied carbon. You review and adjust assumptions as needed.
Report and compare
Slice results by lifecycle stage, building element, or classification system. Compare across design versions. Export for any reporting standard.
What Tangible does
Carbon data you can trust and act on
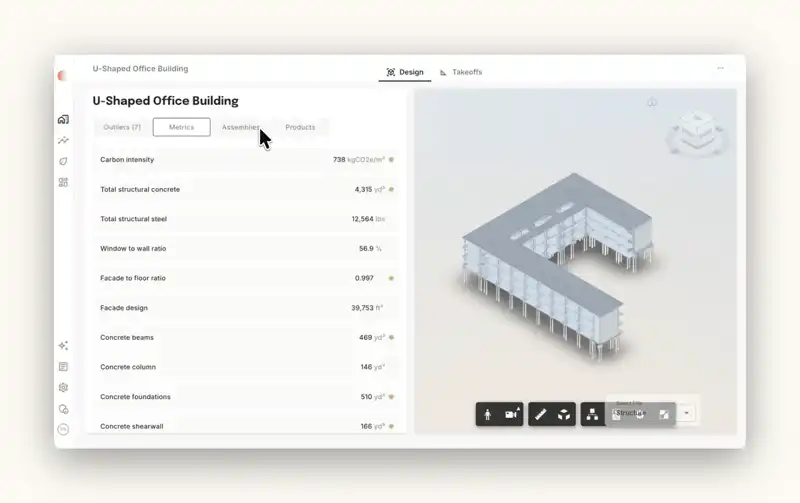
Carbon numbers from your actual design
Tangible reads your Revit model and cross-references your PDF drawings to produce EPD-backed carbon data. Every number traces back to the model geometry and the EPD behind it — structured, traceable data to meet reporting requirements or compare design options.
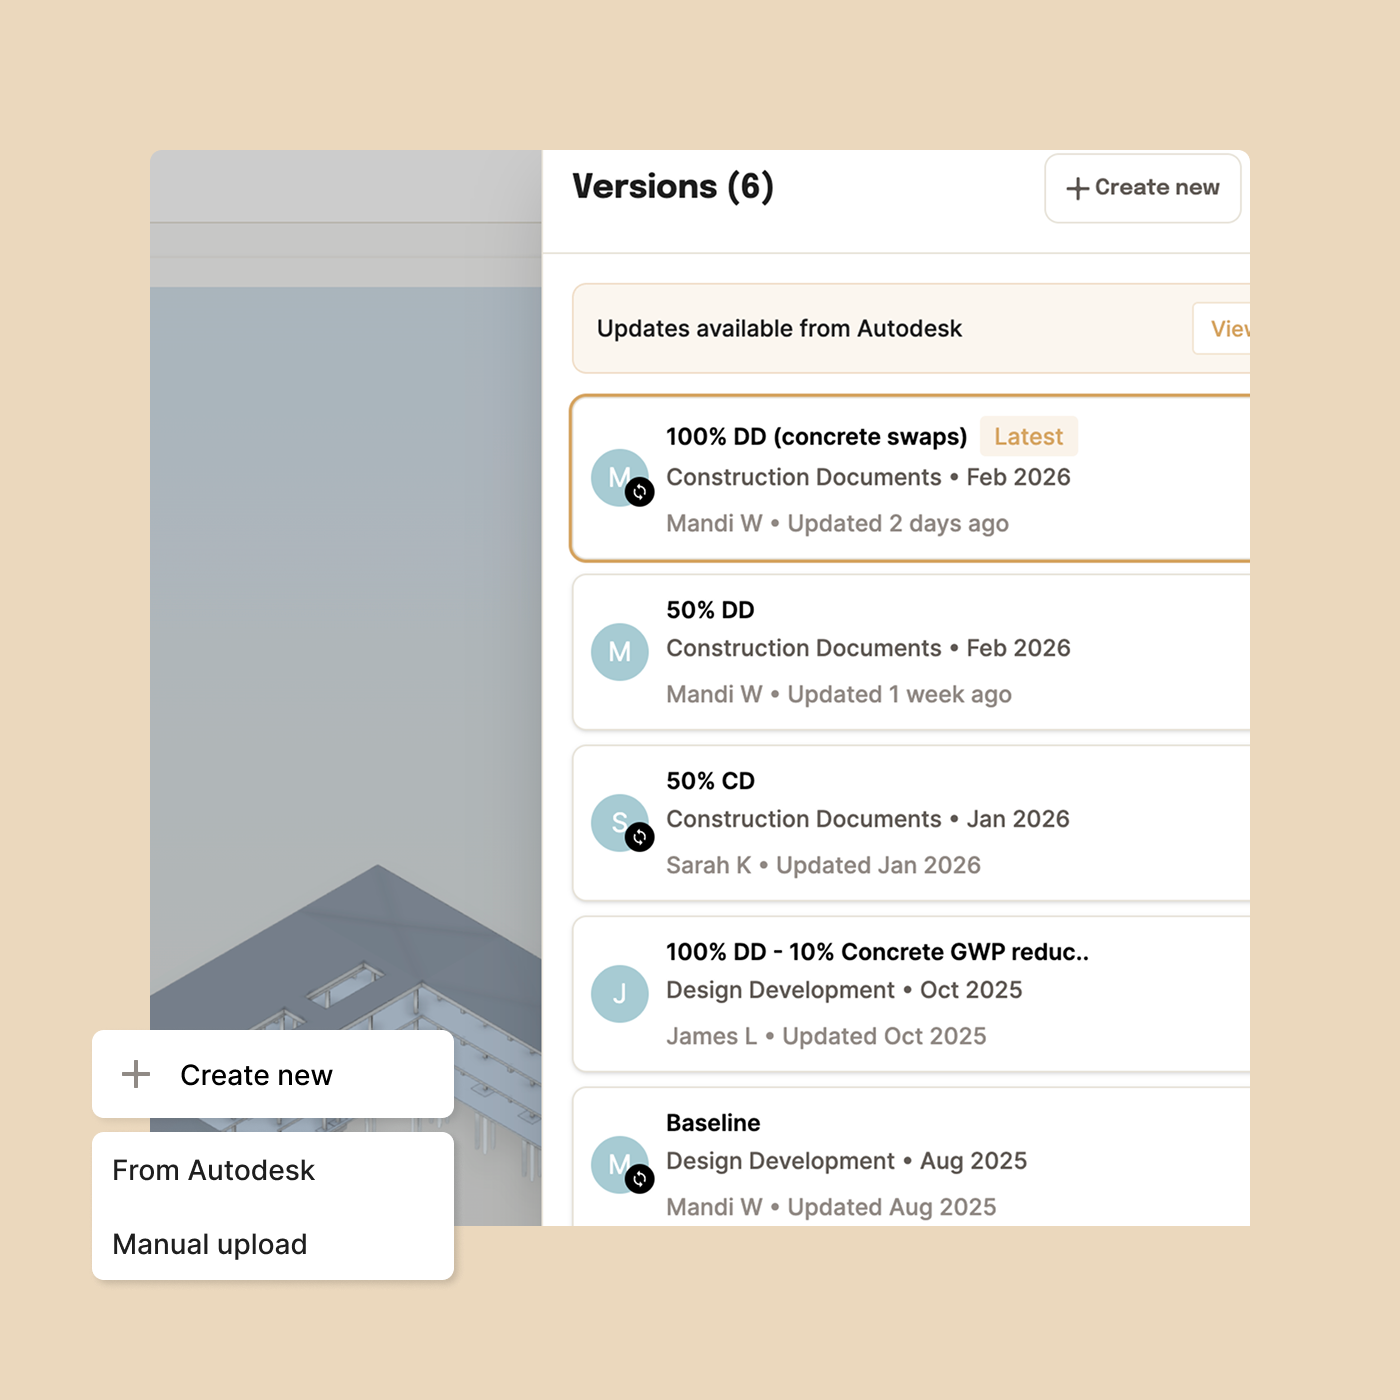
Track carbon as the design evolves
Create versions at SD, DD, and CD. Compare embodied carbon side by side at every milestone. When the design changes, copy a version, swap materials, and see the impact before committing.
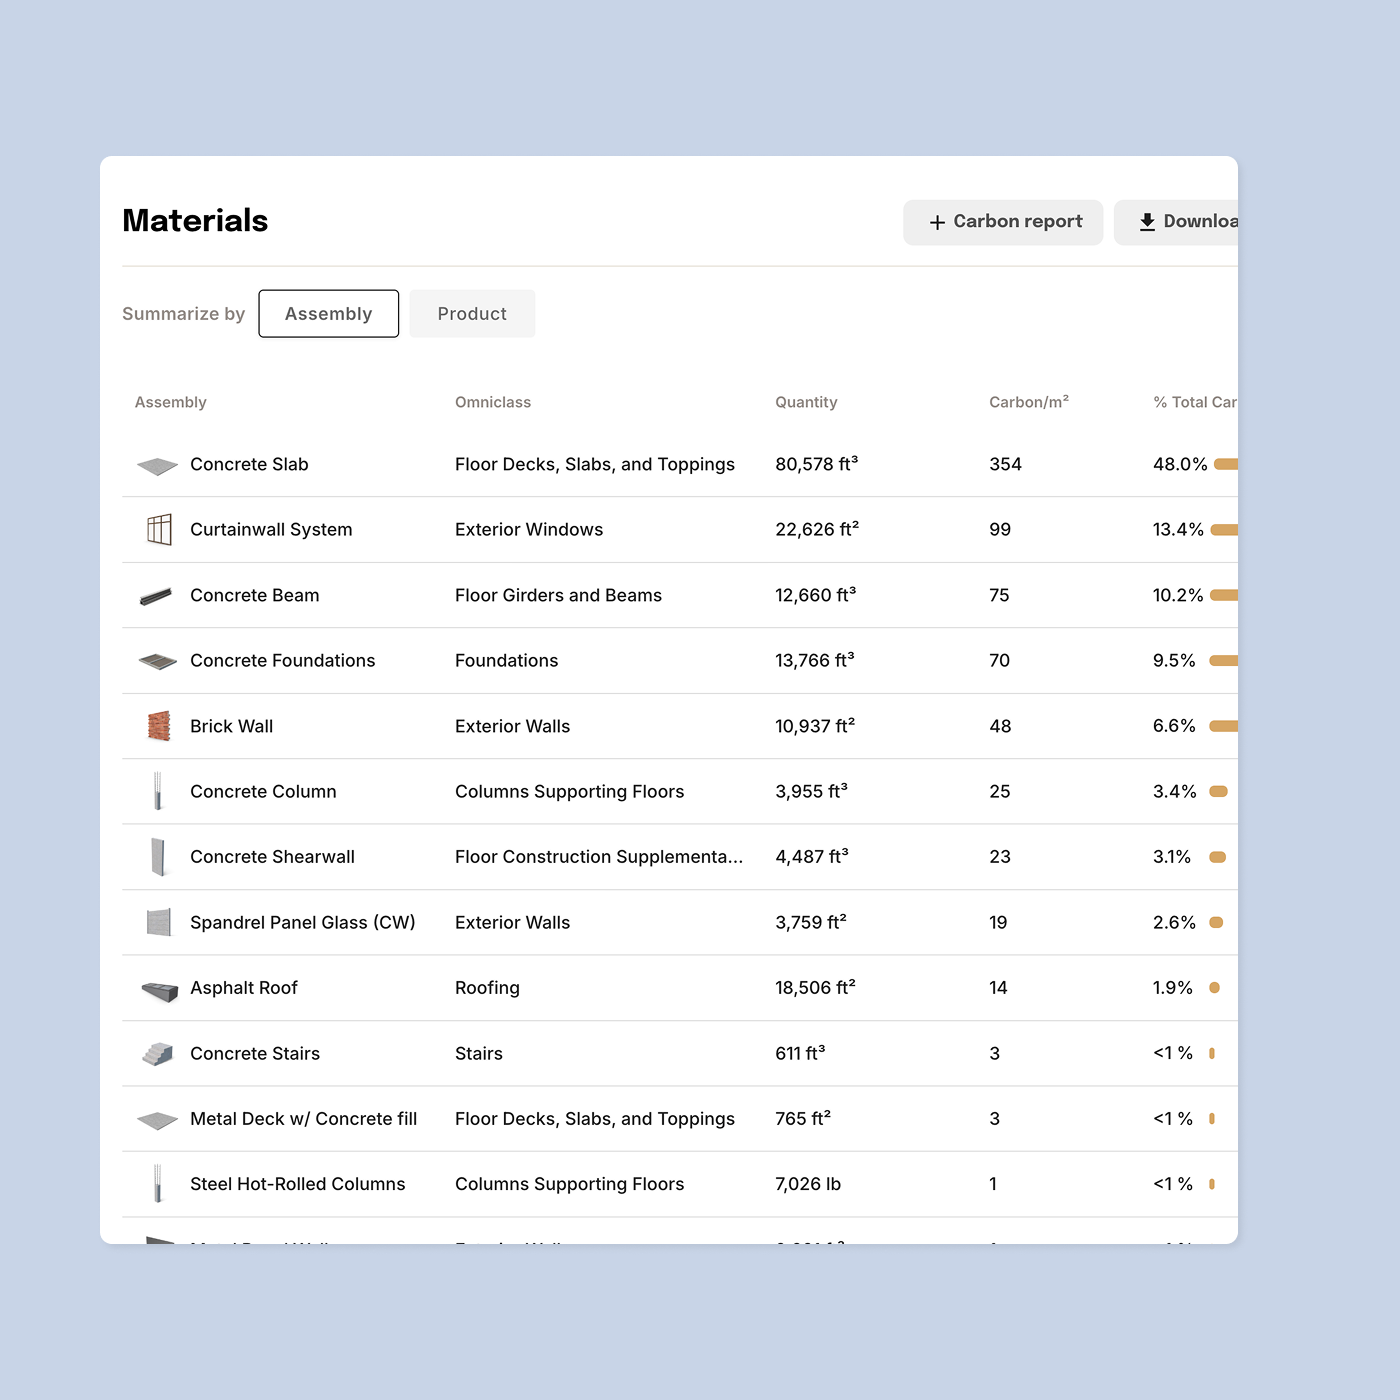
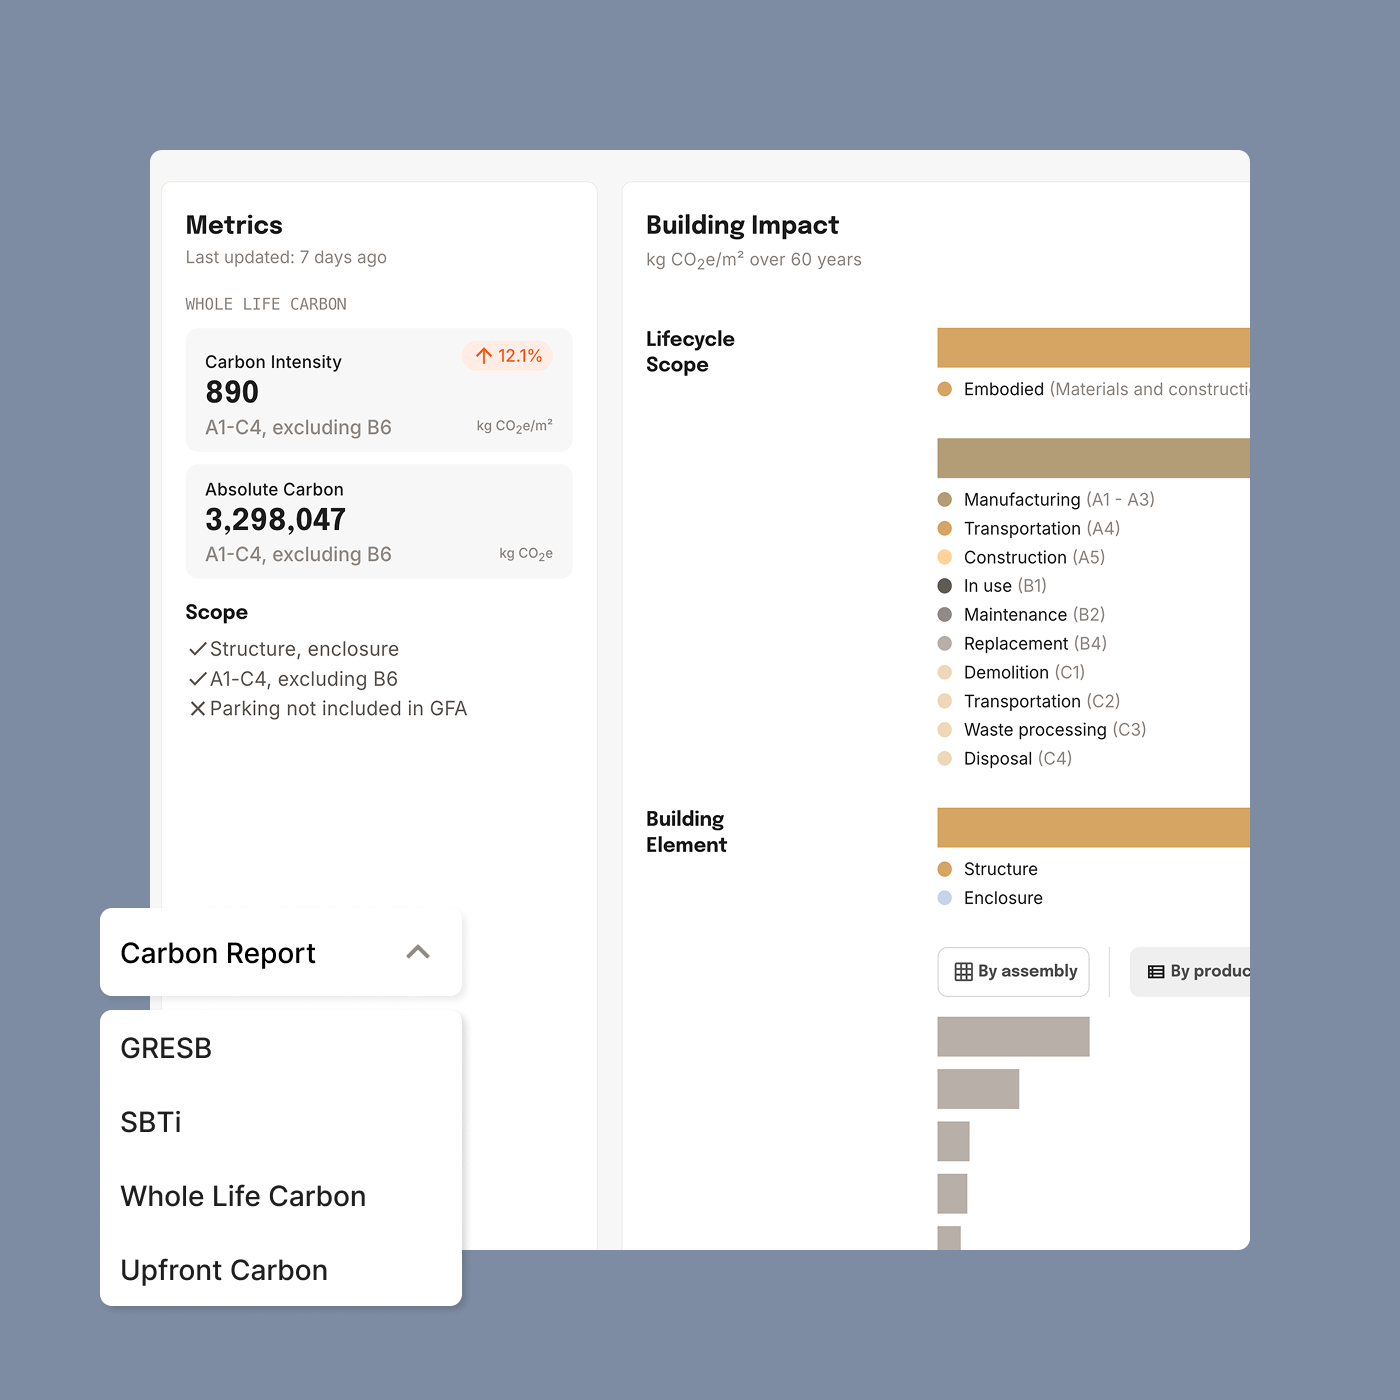
One dataset, any reporting standard
18 predefined reporting scopes — CALGreen, GRESB, ILFI, Toronto Green Standard, and more. Slice the same data by lifecycle stage, building element, or classification system. No rebuilding the analysis for each submission.
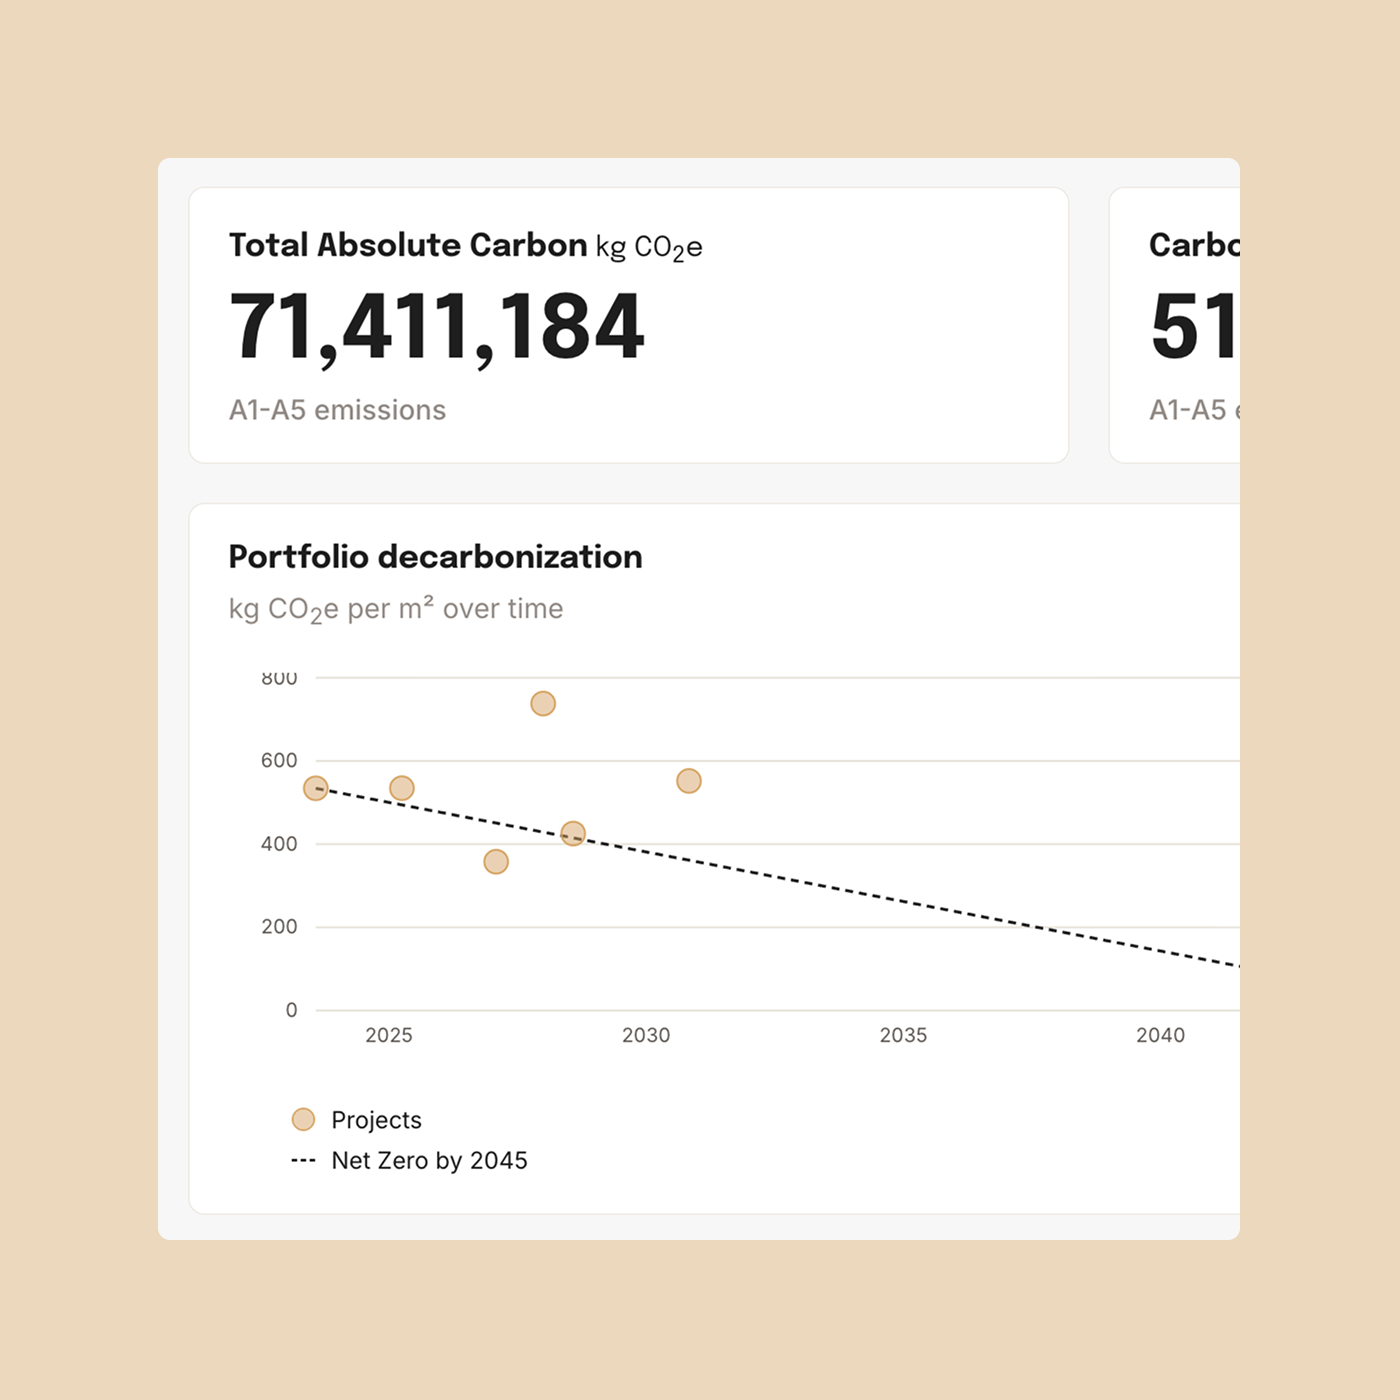
Portfolio-level carbon, automatically
Projects roll up to your portfolio without manual aggregation. Benchmark carbon intensity across buildings, track decarbonization over time, and export at the portfolio or fund level for ESG disclosures.
Why Tangible
What makes this different
Speed
Manual carbon analysis takes weeks. Tangible returns EPD-backed results in hours. Design revisions update in minutes.
Traceability
Every carbon number links to its source — the model geometry, drawing callout, and the EPD behind it.
Consistency
Same EPD selection logic, same baselines, same lifecycle assumptions across every project. Your carbon numbers are comparable without reconciling methodologies.
Frequently asked questions
EPDs are sourced from EC3. Tangible links each material to the best available EPD based on product category, location, and project specs. Each product clearly shows whether the EPD is product-specific or industry-wide, who published it, and when it expires. You can also upload your own EPDs if you have them.
Carbon Leadership Forum (CLF) 2023 Material Baselines for most product categories, based on published industry-wide EPDs. For concrete, Tangible uses NRMCA 2022 Regional Benchmarks in the US and CRMCA 2022 Regional Baselines in Canada. Baselines are location-specific where available, so your project is compared against the right regional average.
Full whole-life carbon: product manufacturing (A1–A3), transportation (A4), construction (A5), in-use emissions (B1–B5), operational energy (B6), and end of life (C1–C4). Tangible assumes a 60-year building life. You can slice results by any combination of lifecycle stages.
18 predefined scopes including CALGreen, GRESB, ILFI, and Toronto Green Standard. Switch scopes without re-running the analysis — the underlying data is the same, Tangible just filters it for the standard you need.
Whatever scope of the building you want to measure. A Revit model paired with PDF drawings gives the most detail, but you can start with what you have. Tangible uses smart defaults and refines them with project-specific information from your drawings.
Tangible starts with smart defaults for every assembly — material compositions, typical specs, standard assumptions. Then it cross-references your PDF drawings to refine those defaults: concrete strengths from the structural schedule, wall assemblies from architectural details, insulation specs from building sections.
Yes. Create versions at SD, DD, and CD. Compare embodied carbon side by side at every milestone. Copy a version, swap materials, and see the impact before committing. Each version preserves its own assumptions and EPD assignments.
Yes. You can swap products and edit quantities directly. The ability to change design assumptions — like wall assemblies or insulation types — is coming next. You review everything before reporting.
Publish projects to your portfolio for auto-aggregated reporting. Benchmark carbon intensity across buildings, track decarbonization trends over time, and export for ESG disclosures — no manual roll-up or spreadsheet merging.
Yes. Your ACC admin installs the Tangible app once, and then any team member can import projects directly from ACC into Tangible. Documents sync from your existing project folders — no manual uploading required.
You get to structured carbon data faster, in a standardized format, with traceability built in. A manual analysis requires assembling quantities, finding EPDs, and building spreadsheets from scratch. Tangible gives you a consistent, auditable dataset from day one.
LEED v5 ready
LEED v5 ready
LEED v5 makes embodied carbon mandatory. Tangible covers the MRp2 prerequisite and MRc reduction credits from your existing design documents.
See what's in your next project
Teams use Tangible to go from design documents to EPD-backed carbon data — in hours.